Investigating Film Popularity Dynamics Through Viewer Metric Aggregation and Algorithmic Platform Analysis
Written by Casey Beck · Aug 22, 2026
Investigating Film Popularity Dynamics Through Viewer Metric Aggregation and Algorithmic Platform Analysis
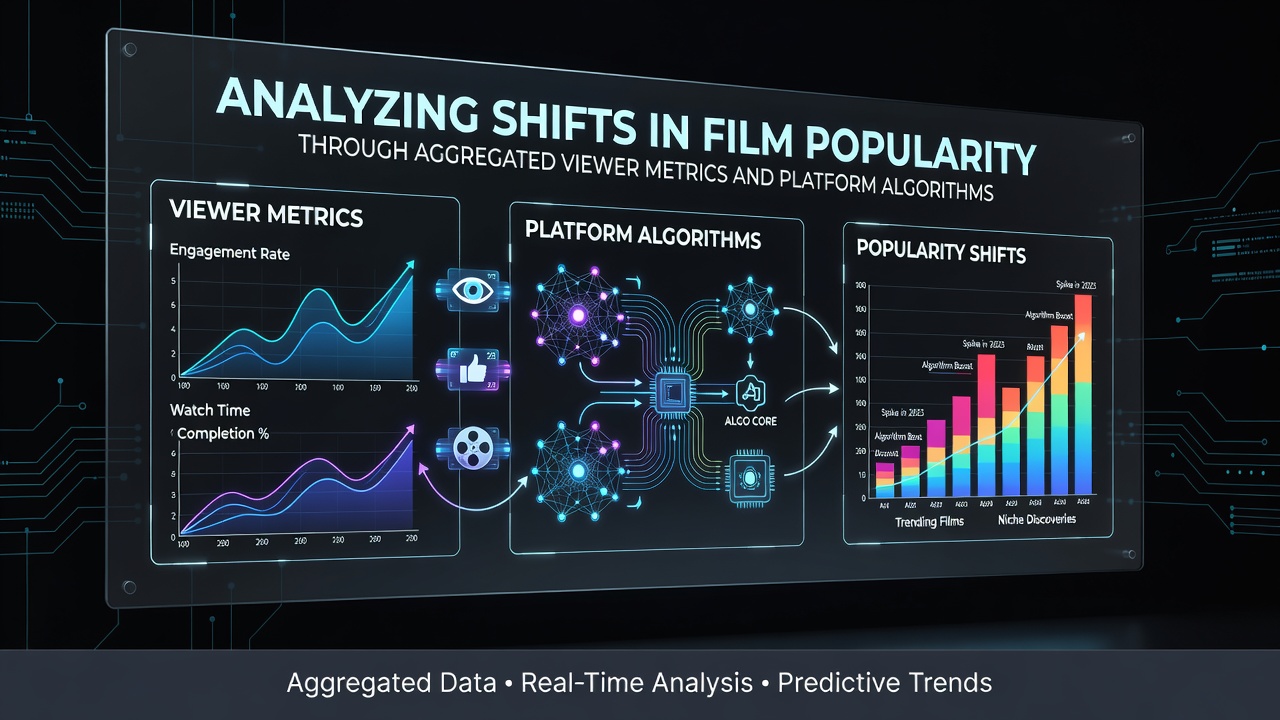
Platforms collect vast amounts of data from user interactions, watch times, and completion rates, then feed those numbers into recommendation systems that adjust visibility for titles across global audiences, and this process has shaped how films rise or fade in public attention since the expansion of streaming services in the mid-2010s.
Researchers track these patterns by combining data from multiple sources including Nielsen reports and academic studies from institutions such as the University of Southern California, which allows analysts to observe correlations between algorithmic promotion and sudden spikes in viewership for certain genres or specific releases.
Data Sources That Feed Popularity Models
Viewer metrics arrive from several channels at once: direct streaming logs, social media mentions, search volume, and third-party measurement firms, while platform algorithms weigh each signal differently depending on the service and its regional market priorities. In August 2026 figures from the European Audiovisual Observatory showed that completion-rate data carried greater weight in European markets than in North American ones, where trailer views and social shares often determined initial recommendation strength.
Those who study these systems note that aggregated datasets help isolate external events, such as major awards announcements or viral clips, from purely algorithmic effects, and this separation reveals how platforms amplify or dampen momentum once a title passes certain internal thresholds.
Algorithmic Mechanisms Behind Visibility Shifts
Recommendation engines typically operate through collaborative filtering that groups users by past behavior, content-based matching that pairs similar titles, and reinforcement learning loops that test small audience segments before wider rollout. When a film performs above predicted engagement levels in early tests, the algorithm increases its placement on homepages and in personalized rows, which in turn generates more data points that can accelerate or reverse the trend within days.
One study from the Canadian Media Fund examined how these feedback loops affected independent films released on major services between 2023 and 2025, finding that titles receiving an initial algorithmic boost retained higher long-term viewership even after the boost ended, compared with similar films that started without extra promotion.
Regional Variations in Metric Influence
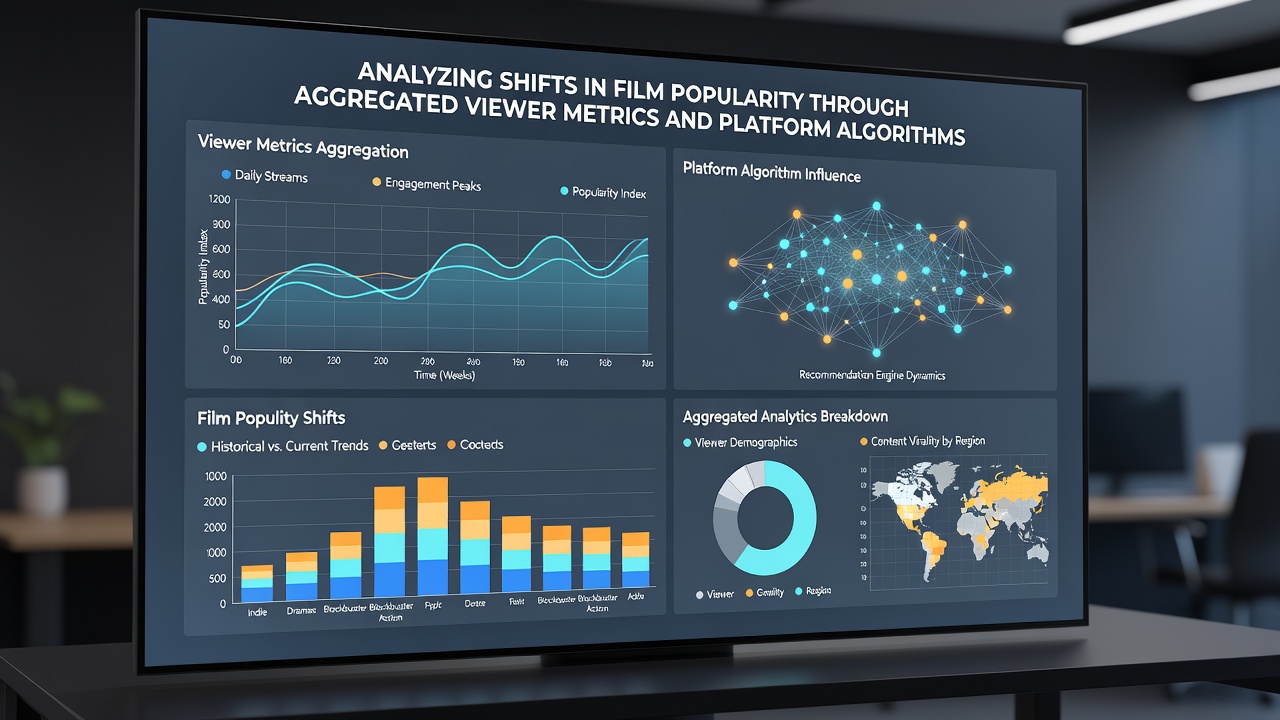
Market differences appear clearly when analysts compare data across territories, because local content regulations, language preferences, and competing platforms alter which signals carry the most predictive power. Australian government media reports from 2025 indicated that local productions gained disproportionate visibility when algorithms incorporated geographic proximity data alongside global popularity scores, whereas imported blockbusters relied more heavily on worldwide completion rates.
Platform operators adjust these weightings regularly, and changes often coincide with updates to privacy rules or new measurement partnerships, which means historical comparisons require careful alignment of data definitions across time periods.
Case Examples of Measured Popularity Movements
Observers documented one instance in early 2026 where a mid-budget thriller experienced a 340 percent increase in weekly views after its trailer appeared in algorithmically generated “because you watched” rows on a leading service, and the surge persisted for three weeks before gradually returning to baseline levels once the placement rotated. Another case involved a documentary that maintained steady but modest numbers until a regulatory announcement about environmental policy coincided with increased search traffic, after which the platform’s system began surfacing the title to users interested in related topics.
These examples illustrate how external signals interact with internal ranking formulas rather than operating in isolation, and aggregated datasets make it possible to quantify the relative contribution of each factor.
Challenges in Interpreting Aggregated Results
Researchers face several obstacles when working with these large datasets, including incomplete access to proprietary algorithm parameters, inconsistencies in how different services define key metrics such as “view,” and the rapid pace at which platforms modify their systems. Cross-platform studies therefore rely on standardized third-party measurements that capture only publicly observable outcomes like chart positions and reported viewership totals.
Despite these limitations, the combination of public data releases and academic partnerships continues to produce clearer pictures of how algorithmic choices translate into measurable popularity shifts across the film landscape.
Conclusion
Analysis of aggregated viewer metrics alongside platform algorithms provides a structured way to trace how films gain or lose audience attention over time, and ongoing data collection from multiple regions supports more precise mapping of these dynamics as services evolve their recommendation approaches.